Agile methodology has become synonymous with success. Over the past few years, Agile methodology has steadily climbed the stairs to become the best management methodology in business. It fosters constant improvement and efficient working.
Transitioning to Agile, although beneficial, requires a few changes in the software development life cycle (SDLC). One is the Agile metrics; Agile metrics is a source of measuring productivity across several stages of the SDLC.
The introduction of Agile metrics in the workflow helps in the successful management of software development projects. With the help of these metrics, companies can keep track of their team’s performance and also assess the overall quality of the end product.
What Are Agile Metrics?
Agile metrics are standards in Agile methodology that help a team monitor their work progress across various software development life cycle phases. The most commonly used metrics to track agile team performance is appended below:
- Productivity
- Progress
- Quality of work
- Performance
- Level of success of the project
- The health of the team
- Predictability
The metrics help stakeholders identify the strengths and weaknesses of the process. Also, with these agile metrics, team leaders can expose issues, if any, in the initial stages and resolve them before they turn into major problems.
Agile metrics produce realistic, data-based results so that you can improve your work performance in the future and learn from your mistakes. These standards are embedded in the project roadmap for efficient monitoring.
What Are The Benefits Of Agile Metrics In Project Management?

The metrics used in Agile methodology have multifaceted benefits, including the following:
- Give a realistic, data-based overview of work progress
- Help keep teams focused
- Encourage consistent self-improvement for better performance
- Aid in timely delivery of quality end products
- Promote transparency across the organization and foster creativity
- Promote self-improvement (SI) for continuous improvement (CI)
- Encourage self-management
List Of The Top 10 Most Important Metrics In Agile Project Management
To make sure that the standards are measured accurately, leaders should narrow down the metrics to a specific number so that the process is simple and straightforward, without any hiccups.
There are several different Agile metrics used by Agile teams, but some of the best amongst them include the following ten:
- Sprint Burndown
- Velocity
- Epic And Release Burndown
- Lead time
- Cumulative Flow Diagram
- Cycle time
- Control chart
- Value Delivered
- Throughput
- Escaped Defects
1. Sprint Burndown
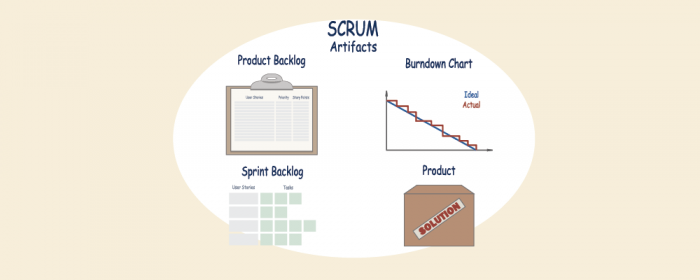
Scrum teams in Agile project management organize their process into sprints. Before the project officially begins, the team decides how much work they can complete in a sprint. A sprint burndown report keeps track of the work progress throughout each sprint.
The output is measured in terms of hours, story points, or backlogs, allowing you to assess your performance against the set parameters. Sprint burndown presents the results in the form of a graph wherein actual scrum tasks are compared with the estimated scrum tasks to identify a team’s performance throughout a sprint.
The most commonly used metrics to track agile team performance is time and tasks. Time is plotted on the x-axis while tasks are plotted on the y-axis, the sprint burndown is measured in either hours or story points.
It helps forecast whether the sprint will be completed in time or not. The most enticing aspect of this metric is that it allows you to visualize how much value a sprint has delivered at any point in the process and how much time is required to complete the project in its entirety.
2. Velocity
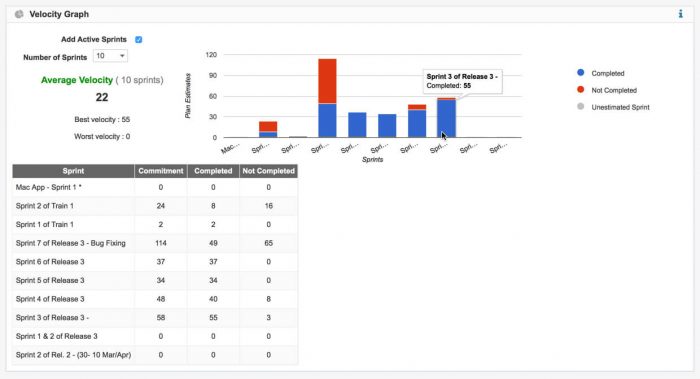
Agile velocity is a measure of the work done during a specific time period. This metric is one of the most popular in agile project management. With the help of velocity, owners can predict the time required to complete a project.
In software development, velocity refers to the rate at which statements are converted into codes. The number of story points accumulated over the past few sprints is equal to the velocity of the project. With the results of this data, you can predict the output for the next few sprints.
It allows teams to predict the amount of work that can be done. The estimates come in handy when teams are planning for future sprints.
The most noteworthy point of velocity is that it is a quantitative metric, it does not cater to quantitative insights. Although velocity is one of the standard metrics, it does not identify the quality of the output, nor does it measure the competence or performance of the team.
Moving on, another most commonly used metrics to track agile team performance is velocity. It indicates that the team is moving in the right direction, while a decline shows that the team needs to work on its performance.
Featured Resources:
3. Epic And Release Burndown
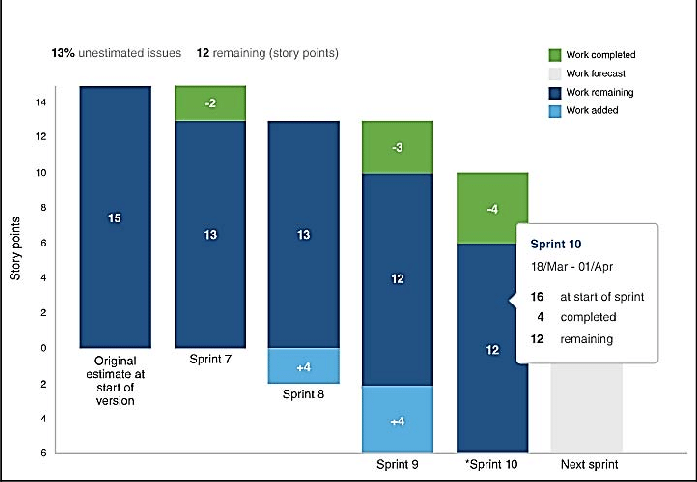
Epic and release burndown is similar to sprint burndown discussed above, the only difference is that epic and release burndown track the progress over a larger work body.
An epic and release burndown chart is a graphical representation of the work remaining over a specific period. Epics represent a larger chunk in which stories are broken down into smaller parts.
A sprint has several epics and versions, and tracking each one of them along with the sprint is important. Thankfully, epic and release burndown makes that possible and keeps the team updated about the workflow in epic and versions.
The completion of work reduced the number of stories in the epic until it reaches zero, this is especially helpful when working via milestones. Likewise, release burndown tracks work progress in case of work committed for a specific release.
This agile metric can help teams in the timely delivery of end products or help them identify whether the delivery time needs to be changed.
4. Lead Time
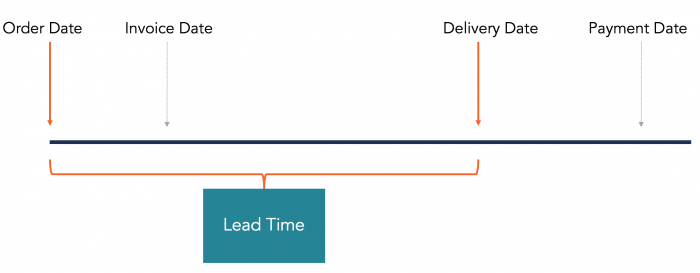
Lead time is a simple and efficient agile metric. It measures the time from the moment a project is initiated till its completion. It starts when a user story enters the backlog and ends when the sprint is completed and delivered to the client.
Lead time is beneficial since it allows teams to identify bottlenecks and also, gives critical insights into the speed of the process. Lead time, cycle time, and velocity are key indicators of a team’s efficiency.
The longer the lead time, the more inefficient your team is and vice versa.
5. Cumulative Flow Diagram (CFD)
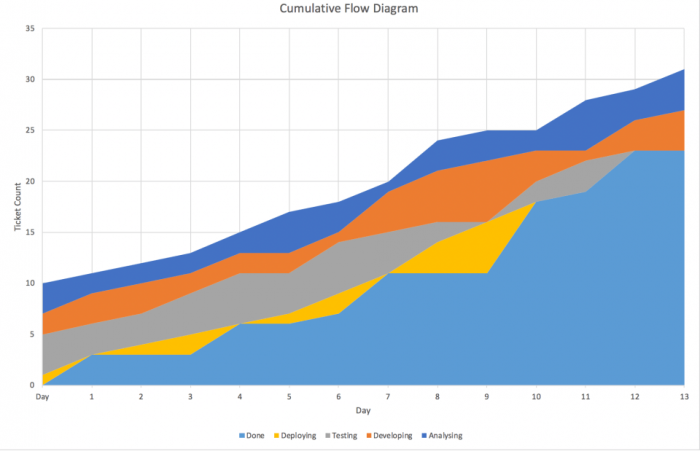
The cumulative flow diagram is another important agile metric, popular amongst agile teams. It makes sure that teams are consistently delivering quality results.
The cumulative flow diagram is basically a Kanban metric in which teams can see the status of different tasks- backlog, in progress, in-review, and done. An ideal cumulative flow diagram is smooth from left to right, any discrepancies in the diagram indicate bottlenecks or issues that need to be addressed.
The metric gives teams a visual overview of all the tasks in the workflow and the overall progress of the project.
The CFD has story points on its x-axis and time on its y-axis. Different colors in the diagram represent different statuses of the tasks.
The most attractive feature of CFD is that it gives a visual representation of the work progress which allows you to identify the bottlenecks and make amendments in the process before they create more chaos.
Moreover, CFD helps track issues in real time so that team members do not have to wait for a meeting to identify issues and resolve them. Teams can efficiently take countermeasures and resolve issues as soon as they arise.
6. Cycle Time
Cycle time is the 6th metric in our list and is quite similar to velocity and lead time. It measures the time takes for a task to move from ‘started’ to ‘in-progress’ or ‘in review.
It measures the time takes to produce a software release. Typically, the cycle time should be half the length of a sprint. The metric is a good indicator of a team’s performance. In case the cycle time exceeds a sprint, it indicates that the team is not completing the work as it is supposed to.
7. Control Chart

A control chart is related to cycle time. It measures the cycle time of individual issues to determine the predictability, behavior, and stability of a process. Consistent cycle times indicate predictable deliveries for the team. Short cycle times, on the other hand, are reflective of high throughput.
Measuring the cycle times allow teams to improve their work progress. The results gathered from the control chart give teams the ability to identify the issues and make amendments wherever necessary so that they can improve their performance.
The chart can be used to measure the failure or success of different processes in the project and can be used to identify defects as well.
8. Value Delivered
This agile metric uses value points to determine the quality of the work delivered to the client. A dollars or points system is used in this metric.
To measure value delivered to a client you can divide the expected revenue by the total value points. Value points can be assigned to each feature or user story. Typically, value points are scattered across several user stories, the completion of each user story indicates more value points.
The goal of a team should be to implement features with high value. The different trends in the chart represent the difference in value delivered. A downward trend shows that the low-value features are being implemented in which case you have to make immediate amendments. An upward trend, on the other hand, indicates the implementation of high-value features.
9. Throughput
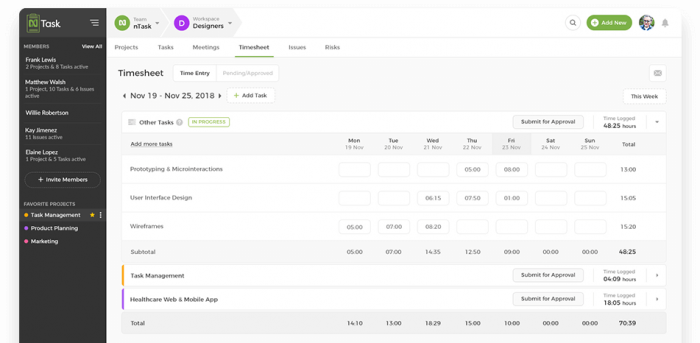
The agile metric indicates the productivity of the team by measuring the number of tasks completed and delivered to the client in a specific time unit. The parameter can be measured quarterly, monthly, weekly, per release, per iteration, etc.
This metric can help stakeholders identify the average time taken for the complete development of software. They can then identify how much software can be completed in a given timeframe. Furthermore, it allows them to see the consistency level of a team.
The data obtained from this metric can be especially helpful in estimating future delivery performances. The more the data, the more accurate the estimations will be.
10. Escaped Defects
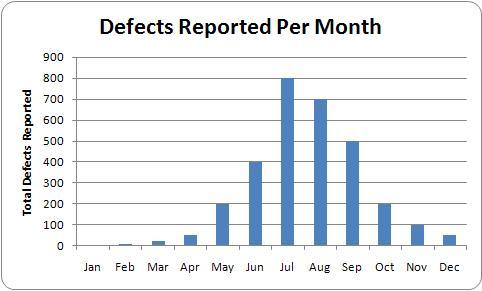
Escaped defects allow you to identify the quality of the products delivered. This metric helps you track the number of bugs discovered after a release enters production.
Ideally, there should be no escaped defects. The identification of bugs after releases poses danger to the product and can cause immense damage. Measuring the defects is essential so that you can identify the loopholes in the process and improve the production process.
Identifying Which Metrics Are Suitable For Your Team
There are several other Agile metrics used by Agile teams besides the ones we mentioned above. So, to identify which metrics are the most suitable for your team, you should consider the following:
- Use Agile metrics in accordance with other metrics to paint a balanced picture.
- Make sure that your team uses these metrics, outsiders should not be the ones implementing these metrics in the development process.
- Use the metrics to address issues and discuss them with your team to use them efficiently.
Ending Thoughts
Agile metrics are an efficient way of keeping track of a team’s performance. Although they are important, choosing and implementing the right ones is also imperative.
The top 10 agile metrics listed above are some of the optimal ones and are popularly used by most agile teams. Whether you use all of the above, a few of them, or a single one, keep in mind the requirements of the end-user.
Remember the results obtained from the use of these metrics are of secondary importance, your primary focus should be to use the data obtained to improve your team’s performance in the future.

